Updated: August 17, 2022
During the pandemic, each state’s governor hosted COVID-19 press briefings and provided American Sign Language (ASL) interpreters. The provision of qualified ASL interpreters in such briefings is critically important for many deaf and hard of hearing people who may not truly understand from captioning showing written English the complex and urgent information that are shared during disasters and other crises. However, it is important to note that having qualified ASL interpreters in these briefings requires more than just planting an interpreter on screen and hoping for the best. Intentional planning is necessary to ensure the optimal use of qualified ASL interpreters during these crucial press briefings.
The National Association of the Deaf (NAD), through its Policy Institute, conducted a study of how each state handled the provision of sign language interpreters during these press briefings during 2020 to assess the clarity and visibility of the interpreters for deaf and hard of hearing people to be able to access. The result is a ranking of all 50 states with respect to how each of them handled interpreter access during official state government COVID-19 press briefings. Each state is ranked from 1 (representing the most accessible) to 50 (representing the least accessible), and states are also given between 0 to 3 “🤟” (“I love you” in ASL) symbols based on the frequency of using deaf interpreters. Full details for how the NAD Policy Institute determined the ranking for each state is provided below.
| 1. Arkansas | 21. Wyoming | 41. Wisconsin 🤟🤟🤟 |
| 2. Nevada | 22. Washington 🤟🤟🤟 | 42. Idaho 🤟🤟 |
| 3. Maryland 🤟🤟🤟(tie) | 23. Iowa | 43. Colorado 🤟🤟 |
| 3. Virginia (tie) | 24. Arizona 🤟 | 44. New Jersey 🤟🤟🤟 |
| 5. Massachusetts 🤟🤟🤟 | 25. Utah 🤟 | 45. New Mexico 🤟 |
| 6. Michigan | 26. California 🤟 | 46. Alaska 🤟 |
| 7. New Hampshire 🤟🤟🤟 | 27. North Carolina | 47. Minnesota 🤟🤟🤟 |
| 8. Hawaii | 28. Texas | 48. New York 🤟🤟🤟 |
| 9. Louisiana | 29. Rhode Island 🤟🤟🤟 | 49. Montana |
| 10. Pennsylvania 🤟🤟🤟 | 30. Vermont 🤟🤟 | 50. Florida |
| 11. South Carolina | 31. West Virginia | |
| 12. Illinois | 32. Georgia 🤟🤟🤟 | |
| 13. South Dakota | 33. Indiana | |
| 14. Kansas | 34. Oklahoma 🤟🤟🤟 | |
| 15. Missouri | 35. Mississippi | |
| 16. Maine 🤟🤟🤟 | 36. Delaware | |
| 17. North Dakota | 37. Nebraska | |
| 18. Tennessee | 38. Ohio 🤟🤟🤟 | |
| 19. Oregon 🤟🤟🤟 | 39. Connecticut | |
| 20. Kentucky | 40. Alabama |
District of Columbia Ranking:
While the project focused on state governors in all 50 states, the briefings done by the Mayor of District of Columbia (D.C.) was also analyzed and given a score. However, it was not grouped with the other state rankings since D.C. is not a state and has a different governmental structure. Notwithstanding this difference, it was important to include an accessibility assessment of D.C.’s COVID-19 briefings, given the size of the deaf and hard of hearing community in D.C. If it were a state, DC would be ranked 20th based on its score. DC also gets recognition for primarily using deaf interpreters for their briefings, which gives them three “🤟” symbols (further explained below).
Policy Institute Background:
In 2018, the National Association of the Deaf (NAD) established its Policy Institute to develop and promote best practices and policy statements regarding equal communication access for deaf and hard of hearing people across various areas of life. Specifically, the Policy Institute seeks to objectively measure communication accessibility in specific categories and from there create rankings that are then publicly shared. Such rankings can demonstrate best practices and optimal accessibility, which then can be used by the affected industries to improve their practices to be more inclusive of all people. The NAD welcomes dialogue with any entity to collaborate on ways to improve accessibility for all deaf and hard of hearing people.
The NAD Policy Institute has three goals:
- Promote change in all areas of society to improve access for deaf and hard of hearing people;
- Develop and identify best practices for full communication access for deaf and hard of hearing people across various aspects of life and develop position statements outlining best practices;
- Recognize and reward leaders in ensuring full communication access for deaf and hard of hearing people.
First Ranking Project:
When the COVID-19 pandemic hit and became classified as a national emergency, the deaf and hard of hearing community were frequently deprived of communication access to critical and urgent information. The NAD looked at each state to see how they were ensuring communication access to pandemic information for their deaf and hard of hearing residents. The NAD encouraged deaf and hard of hearing individuals across the country to demand full and equal access to all information regarding COVID-19 and to best protect ourselves and our families. The bulk of pandemic information came from the White House and each state’s governor. The accessibility of information from each governor for deaf and hard of hearing individuals varied greatly.
To encourage best practices, the NAD Policy Institute initiated a study of the COVID-19 briefings for all 50 states’ governors during the time frame of March 1, 2020 to December 31, 2020. This limited time was chosen as it was the height of the pandemic, and most states significantly decreased their press briefings after 2020. The goal was to objectively measure access to critical information about COVID-19 in ASL through the use of professional ASL interpreters. The assessment included a measurement of the percentage of how many of each governor’s briefings had ASL interpreters present. In addition, we took measurements to assess the visibility of the ASL interpreters during the broadcasts, regardless of whether the interpreters were shown next to the governors in person or via Picture in Picture (PIP) format. We chose these factors to gauge how visible the interpreters were to deaf and hard of hearing viewers.
Limitations of the Ranking Study:
As is the case with all rankings, this ranking project has some limitations. Our research of what each state did with the COVID-19 briefings was based on a review of the online posting of these governors’ briefings, working off the assumption that all of their briefings were posted online. Further, we looked at official Governor’s Office versions that were readily available online. The goal of this ranking is to assess the services provided by the governors’ offices which required us to analyze what the governors provided. However, in the event an official video could not be located, we analyzed television broadcast versions that were archived on the Internet and had the best available view of the interpreter as part of this project’s goal is to assess what was available to deaf and hard of hearing people watching at home. This ranking also focused on objective metrics and avoided the subjective assessment of interpreter quality. For that reason, the ranking system does not take into account what qualifications each interpreter had or whether deaf interpreters were used but federal laws mandate the use of qualified interpreters. While we encourage the use of deaf interpreters whenever possible for press briefings such as these, not every state has deaf interpreters available pursuant to their requirements. Consequently, the ranking was designed to focus on the provision of qualified interpreters rather than penalizing for not using deaf interpreters.
Ranking Factors Development:
Prior to data collection, the Policy Institute team assessed and identified all possible objective factors that should be considered when ranking COVID-19 statewide briefings as to their level of accessibility through ASL interpreters. This process ensured that each factor could be objectively measured and consistent across different modes of briefings.
At the beginning of the COVID-19 pandemic, many states held briefings with the ASL interpreter present in-person next to the governor while following COVID-19 protocols. As the pandemic continued, some of these states switched to a PIP format, which meant that the ASL interpreter would be on a separate video feed that is placed in a boxed area on the broadcast screen. No determination was made as to whether it was better to have the interpreter provided in-person or through PIP video feed, given the many variables involved, especially during a health pandemic. Instead, the rankings focused on the visibility and clarity of interpreter communication in each setting (in-person vs. PIP).
The following factors and scoring measurements were used to assess in-person briefings:
| Factor | Definition | Rubric |
|---|---|---|
| Angle | Placement of interpreter in relation to the camera in terms of profile | 4 – consistently facing forward3 – fluctuates between forward and off-center2 – consistently off-center |
| Depth | Placement of interpreter in relation to the camera in terms of closeness | 4 – both speaker and interp clearly visible and take up most of the screen2 – clear but a bit far in depth0 – not clear and far in depth |
| Lighting | Visibility of the interpreter based on brightness | 4 – clear and visible2 – semi dark / bright0 – too dark / bright |
For PIP briefings, the factors and scoring mechanisms were as follows:
| Factor | Definition | Rubric |
|---|---|---|
| Depth | Placement of interpreter in relation to the camera in terms of closeness | 4 – clear and fully in frame2 – clear but a bit far in frame0 – unclear and far in frame |
| Lighting | Visibility of the interpreter based on brightness | 4 – clear and visible2 – semi dark / bright0 – too dark / bright |
| Size | Ratio of PIP size to the overall screen size | 4 – 25% or more3 – 15% to 25%2 – 10% to 15%1 – 5% – 10%0 – less than 5% |
| Location | Location of the PIP screen in relation to other information on the screen | 4 – location does not block captions or other information2 – partially blocks0 – fully blocks |
| Focus | Visibility of the interpreter based on clarity | 4 – in focus2 – slightly blurry0 – blurry |
Another factor that was assessed with both the in-person and PIP settings was how the governors’ briefings incorporated visual aids (such as PowerPoint presentations) and whether such visual aids adversely impacted the visibility and clarity of the interpreters. For example, some states used visual aids that had the effect of reducing the size of the PIP showing the interpreter, reducing the visibility of the in-person interpreter, or removing the interpreter from the screen entirely. If the majority of the states’ briefings had such an adverse impact on visibility and clarity of the interpreters when using these visual aids, then these states’ ranking score received a demerit of .25 from their overall score. The demerit scoring was based on the states’ use of visual aids that adversely impacted visibility and clarity between May and December 2020, as a grace period was given to the states for the first two months of the pandemic so that they could figure out how to appropriately incorporate visual aids in their briefings without affecting the view of the interpreters.
The ranking factors also included the percentage of briefings that had ASL interpreters against the total number of briefings.
Ranking Development and Formula:
After establishing the factors that would contribute to the accessibility ranking, the NAD Policy Institute determined the formula for calculation of each state’s ranking score, as follows:
- For each factor included in the ranking score, the median was calculated across all briefings.
- A weighted mean score was calculated separately for in-person factors and PIP factors. Each of the in-person factors had the same weight. However, the PIP factors were weighted differently with the PIP size being 50% and the remaining four factors being 12.5% each. The rationale for this is the size of the PIP is the predominant factor in visibility and clarity, and having a small PIP size would significantly impede interpreter visibility even if there was perfect depth, lighting, focus, or location.
- A weighted mean was then calculated to take into account the number of in-person briefings and the number of PIP briefings for each state as follows:
(Number of in-person briefings * in-person mean) + (Number of PIP briefings * PIP mean)/Number of in-person briefings + Number of PIP briefings
- To avoid the possibility that the visual aid usage demerit caused a negative ranking score, the demerit was subtracted from a score of 4. This result was then added to the weighted mean and divided by 2.
- To create the final ranking score, the result from step 4 was then multiplied by the overall frequency of ASL interpreters provided by that state’s governor.
Data Collection:
To evaluate the briefings based on the factors discussed above, all discovered recorded briefings were obtained from state websites, official social media channels of the governor, and/or the use of YouTube search with the following keywords: “governor conference coronavirus covid 2020 “[insert state]”. These obtained recordings of briefings for the period of March 2020 through December 2020 were the basis of measurements that supported their rankings based on the above described factors.
For each state, the briefings were reviewed for: the mode by which interpreters were provided (in-person vs. PIP); the above described ranking factors; and frequency of instances where interpreters were provided against all briefings. All state briefings were viewed and measured on a laptop computer with the following metrics: height =7.2”, and length = 11.4”. For all states that had interpreters provided on PIP, the PIP size was determined by calculating the area of the PIP screen (length x height) on the laptop divided by the area of the full laptop screen (length x height) and converting the result to a percentage. The assumption was that the PIP percentage would be consistent regardless of computer size, our approach was to utilize one consistent computer screen size to measure the PIP size for all briefings that used PIP to show the interpreter.
The NAD retained a statistical consultant to ensure that this ranking project was done accurately, reliably, and in adherence to scientific standards and rigors. All scores for each factor were reviewed by a panel including the NAD CEO, the NAD Policy Institute director, and the aforementioned statistical consultant.
Special Recognitions:
All briefings were reviewed to determine if the state used a deaf interpreter (whether certified or not). This determination was done by identifying each interpreter used, at times through the help of various state associations as well as through the expertise of deaf interpreters. Given the lack of deaf interpreters in some states and the need to avoid penalizing states for not being able to retain deaf interpreters, the ranking was designed to focus entirely on the visibility and clarity of the interpreters and not the qualifications or type of interpreter. Consequently, there is no factor or score based on the use or non-use of deaf interpreters. Instead, the use of a deaf interpreter by any state merited recognition with the “🤟” symbol with the following format:
90-100% of the time: 🤟🤟🤟
60-90% of the time: 🤟🤟
25-60% of the time: 🤟
A different kind of recognition indicated by a star was awarded to North Dakota for being the only state to consistently provide an interpreter in person when not using a visual aid and then when a visual aid is used, show the interpreter visibly and clearly through a PIP. The systemic use of this combined and innovative approach ensured that the interpreter was clearly visible at all times throughout the briefings. This merited a special recognition for North Dakota.
Recognition should also be accorded to states that went above and beyond providing interpreters at the Governor’s press briefing. For example, New Jersey provided a separate video feed in real time with focus on ASL interpreter visibility between April 2, 2020 and June 8, 2020. Michigan took the approach of using an out-of-state deaf interpreter to summarize the Governor’s statements after the briefing, as a way to make the briefing more clear given additional time and as a workaround given the lack of qualified in-state deaf interpreters. Other states such as Maryland and Georgia offered recap summaries of the briefings in ASL.
Policy Analysis:
This ranking shows that the top six states were Arkansas, Nevada, Maryland, Virginia, Massachusetts, and Michigan. What set them apart from other states was their success in ensuring greater visibility of the interpreters through a combination of factors including optimal lighting, size, and angle. Whether a state displayed their interpreters in-person or via PIP was not as important as how clear and visible the interpreters were in either format.
Unfortunately, there are at the present time no standards for the size and positioning of PIP. The sizing of PIPs used by various states ranged from taking up barely 3 percent of the screen (ex. Delaware, Nevada, and Colorado – see Exhibit A) to as large as 27 percent (Missouri – see Exhibit B). Generally speaking, the larger the PIP size, the easier it is for deaf and hard of hearing people to see the interpreter and thereby access important information.
Based on the review of these videos, the NAD Policy Institute strongly recommends that the PIP size used for interpreters be at least 25 percent of the screen (ex. Oregon and Pennsylvania – see Exhibit C. PIPs that are smaller than that present difficulty for deaf and hard of hearing people to see and understand the interpreters. Given the tremendous impact of PIP size on the visibility of interpreters during important broadcasts such as the pandemic briefings, the NAD is advocating for legislation that would establish minimum standards for PIP usage on television or Internet broadcasting.
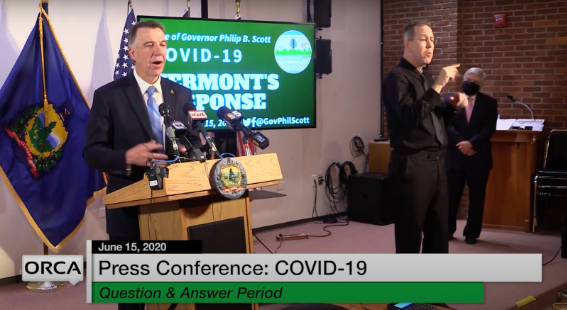
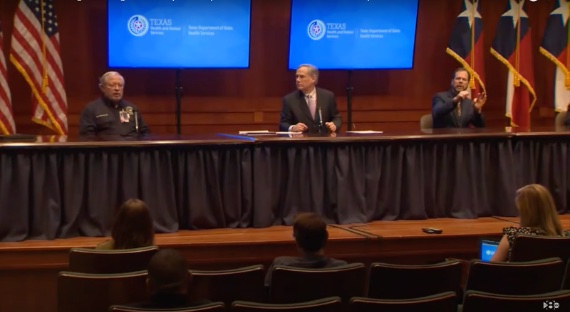
States ranked at the bottom shared several significant deficits. Some states repeatedly failed to provide interpreters at all, while other states failed to provide appropriate clarity and visibility (with regard to size, angle, depth, lighting, et cetera – see Exhibit D) of the interpreters, whether the interpreter was provided in-person or via PIP.
The data collected demonstrates that best practices for the clearest and most visible presentation of ASL interpreters during any broadcasted briefings are as follows:
- Provide qualified ASL interpreters at every briefing, and preferably Deaf interpreters if possible.
- Position the in-person ASL interpreter as close to the Governor as possible with the camera showing both on screen with a close up to the maximum extent possible while still showing the interpreter’s range of motion in entirety.
- Ensure that the PIP video feed of the ASL interpreters is set to a minimum of 25 percent of the video screen.
- Secure appropriate lighting on the ASL interpreters (ex. make sure that the interpreters are not too bright or too dark).
- To ensure a proper angle of the ASL interpreters during broadcasts, the Governor’s Office should direct all video cameras to be positioned head-on, rather than from the side. Full control of the layout of the room will ensure optimal angles.
- To ensure sufficient visibility of the ASL interpreter, make sure skin color and clothing contrast appropriately with each other, and in relation to the background as well.
- Do not place the interpreter in front of a busy background (ex. flags or monitors).
- Be mindful of the varying heights and widths of interpreters. For instance, when two interpreters switch off, they may be of different heights, causing the second interpreter’s face to be cut off camera. Adjust cameras accordingly when there is a switch in interpreters throughout briefings.
- Ensure that the size of the ASL interpreter PIP or framing of the in-person ASL interpreter is never reduced when using visual aids such as PowerPoint presentations. Use of PowerPoint presentations should not unduly affect coverage and visibility of the interpreter
- When using a PowerPoint presentation with ASL interpreters in PIP mode, avoid displaying a wide frame of the Governor and interpreter in one PIP screen together. This will cause the interpreter to seem smaller in the PIP screen (see Exhibit E). Instead, dedicate a PIP screen of sufficient size – minimum 25% as referenced above – to the interpreter alone (see Exhibit F).
- When using a PowerPoint presentation with ASL interpreters in person, avoid expanding the camera frame to include any poster or graphics in the room that would cause the interpreter to be reduced in size in the video frame.
- If a press briefing is being held through video-conferencing (such as Zoom or Microsoft Teams or Google Meet), be mindful of the choice of video-conferencing platform with regard to availability of certain accessibility features. Also, avoid broadcasting in speaker view as this emphasizes the aural aspect of the briefing and disregards the need to ensure the ASL interpreter is fully visible throughout. Instead, a gallery view of the screen should be utilized.
- During a press briefing that incorporates pre-recorded clips, it is essential to have the ASL interpreter in PIP format included in the pre-recorded clip to ensure that there is no interruption of the ASL interpretation throughout the briefing.
- If the Governor leaves after the briefing but before a Q/A session with other state officials, the interpreter(s) should stay for the entire duration of the Q/A session to ensure full accessibility, even if the Governor is not present.
- If the briefing is conducted outside, be mindful of sun glare and placement of the interpreter.
- Collaborate with local television broadcasters to clearly include the in-person or PIP interpreters in their broadcasts of the Governor’s briefings.
Conclusion:
The NAD’s Policy Institute collected and analyzed data and information from the 2020 press briefings of all states’ governors to objectively measure access via ASL interpreters for the benefit of deaf and hard of hearing individuals during the pandemic. The main takeaways from the policy analysis of the data is that as a best practice, governors’ offices need to always provide an interpreter for their emergency briefings and optimize their visibility (whether in-person or via PIP) through appropriate lighting, camera angle, and depth. Such ideal conditions need to be planned in advance by all states’ governors, their staff, and the media team working with the governors offices to achieve full accessibility for all deaf and hard of hearing people in their respective states. Moreover, it is critical that local television broadcasters do more to include proper framing of interpreters on screen during all broadcasts of such press briefings to fully serve all viewers including those who are deaf and hard of hearing.
****
If readers have questions or concerns about the data presented in the ranking or the results, please contact the NAD at [email protected]. State officials that believe our data may have inaccuracies or gaps are encouraged to contact us at that email as well.
Credit to:
- Zainab Alkebsi, Policy Counsel and Director of Policy Institute, NAD
- Howard A. Rosenblum, CEO and Director of Legal Services, NAD
- Dr. Kari Hansen, Statistical Consultant to the NAD
With valuable assistance from:
- Sara Williams, NAD intern
- Jacqueline Ting, NAD intern
- Shauna Kwag, NAD intern
- Lexi Hill, NAD intern
- Nora Hoffman, NAD intern
- Robin Stoller, NAD intern
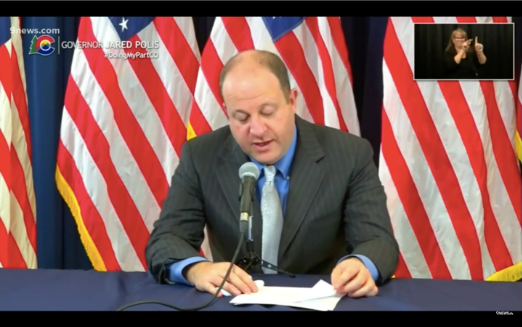
Exhibit A
Image of 2.92% PIP size (Delaware 3-22-2020)
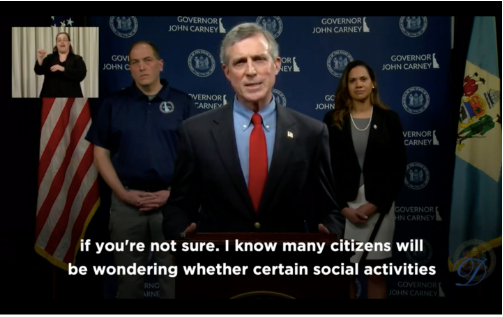
Image of 3.05% PIP size (Colorado 10-20-2020)
3.48% PIP Size (Nevada 4-21-2020)
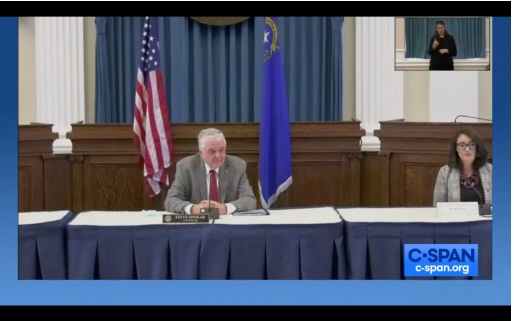
Exhibit B:
Image of 27.18% PIP size (Missouri 05-04-2020)
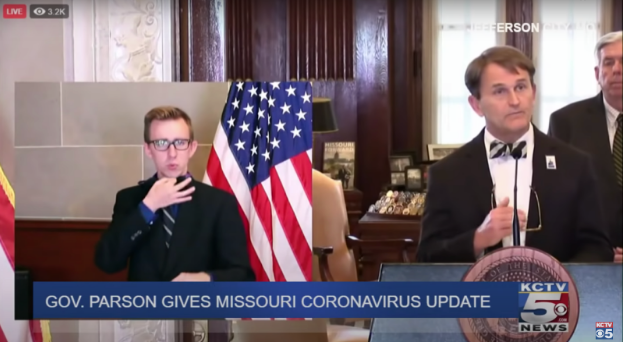
Exhibit C:
Image of 24.34% PIP Size (Oregon 04-14-2020)
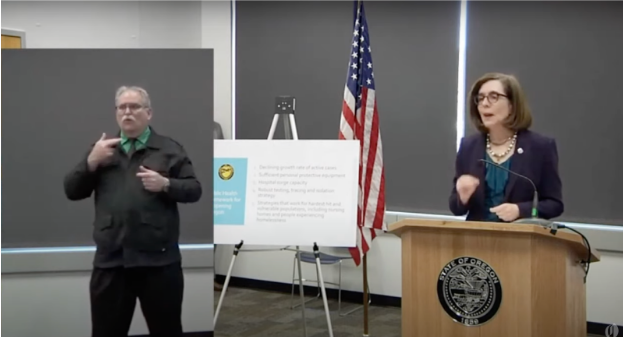
Image of 23.59% PIP size (Pennsylvania 6-17-2020)
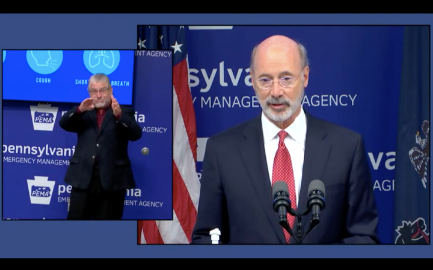
Exhibit D:
Images of poor clarity and visibility (with regard to size, angle, depth, lighting, et cetera)
(Vermont 6-15-2020)
(Texas 04-10-2020)
(Colorado 04-20-2020)
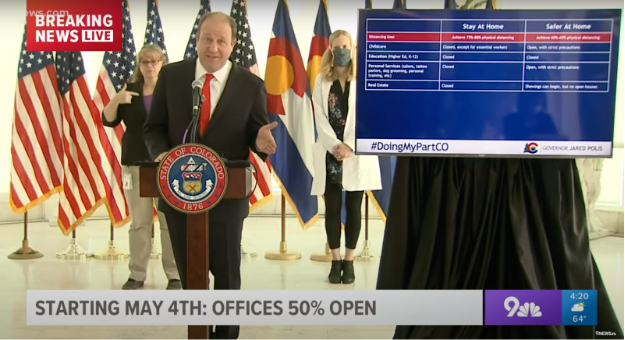
Image of PIP example of poor clarity and visibility
(New Jersey 04-18-2020)

Exhibit E:
Image of shrunken interpreter during PowerPoint Presentation (Kentucky 3-15-2020)
Exhibit F:
Image of PIP screen of sufficient size during PowerPoint Presentation (North Dakota 4-3-2020)